Supermetrics reinvents reporting and dashboards with Google Data studio
Did you know that marketers spend approximately 30 hours every month on reporting? Well, The need to collate data from different platforms and compare them to get better insights Into your marketing campaigns can really take a toll on the marketers.
This is because online marketers have a variety of other important tasks to perform. And the problem of data interpretation and visualisation just adds on to the burden. Considering the wide array of online platforms from where marketers bring in the traffic, it is quite common to find them surrounded by huge piles of data, trying to make sense out of it.
Believe it or not, the process of reporting and analytics is becoming complex. It is becoming increasingly difficult to compare data sets and the efforts marketers put into making a particular campaign successful.
This is exactly where Supermetrics comes to the rescue. We are going to go through Supermetrics and everything associated with it in this extensive Supermetrics guide. Supermetrics, as claimed by many marketers out there, is a go-to business analytics tool that can help you analyse and report your marketing campaigns with ease. Let’s find out what it has for you!
What is Supermetrics?
Supermetrics is essentially a business analytics software that keeps all your metrics and performance-related indicators unified and easily accessible. Although it was initially launched to help businesses make sense out of the Google Analytics data, Supermetrics has quickly evolved into A full-blown business reporting platform one can use in 2020.
You can automate the reporting processes as all the data from different data sources like Google Analytics, Google Ads, Bing Ads, Google Webmaster Tools, and other social media platforms can be Imported and transformed into well-designed spreadsheets at a push of a button.
What Are The Benefits of Using Supermetrics?
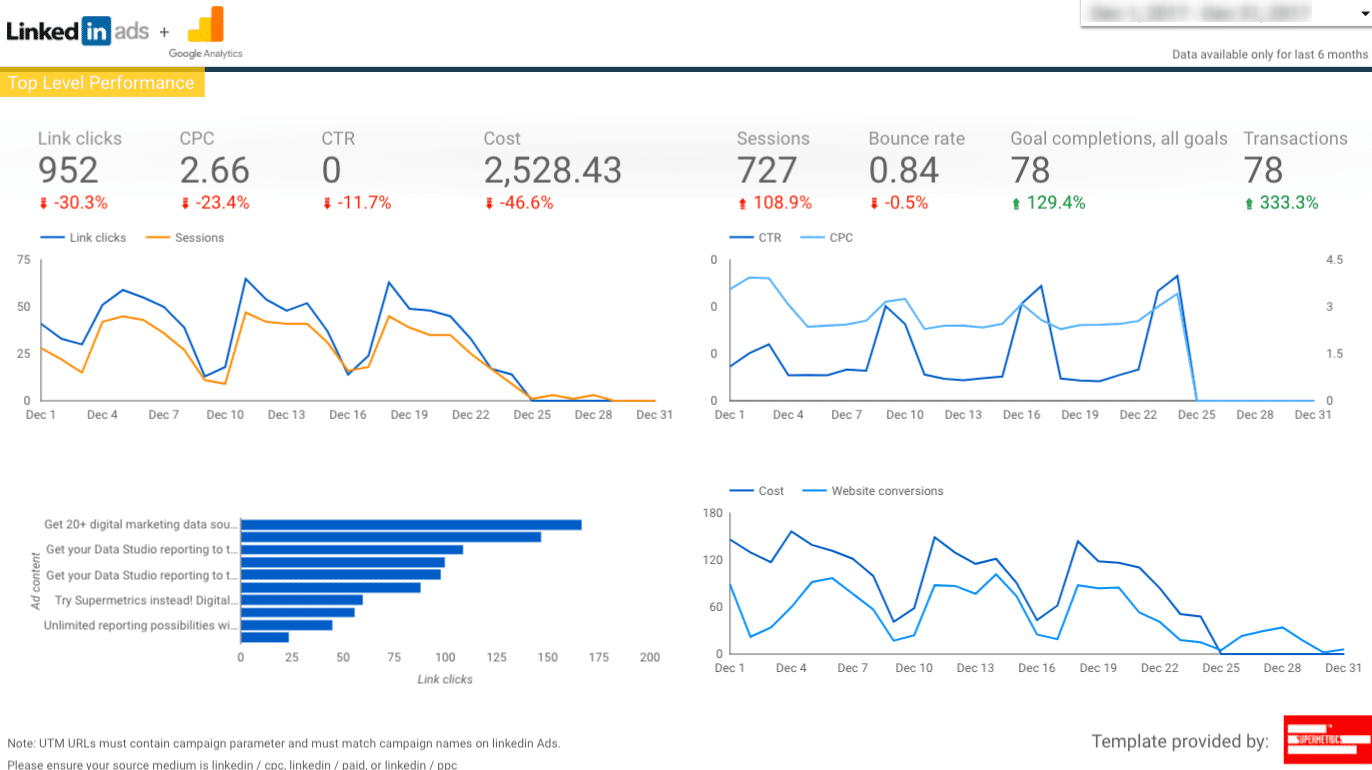
There are so many benefits of using Supermetrics to automate reporting and analytics. The first one is obviously that if you combine Supermetrics with Google Data Studio you can built custom reporting and analytics dashboards that show all of your Marketing channels results live on a unified dashboard. Gone are the days you have to open 10 browser tabs and login to many sites in order to get your daily updates. As we all know, combining all data sources, extracting data and creating reports and graphs can take a lot of time. Therefore, it’s time we understand how Supermetrics helps to become an efficient online marketer and how it supercharges Google Data Studio with the most advanced data connectors in the industry.
Supermetrics reinvents reporting and dashboards with Google Data Studio
1. Allows multi-channel reporting
Supermetrics can be integrated with many online platforms that are used for or marketing or analytic purposes. The most common integration can be found with Google Analytics, Google ads, Facebook ads, Bing ads, and a few social media platforms.
Multi-channel reporting allows marketers to have a single view for all the channels which allows them to perform faster analysis. You can even use it to compare the data of different accounts associated with the same channel.
If you are working with a client that has multiple accounts, it can take you hours to analyse the data and compare it for performance analysis. With Supermetrics you can get this done in under 5 minutes.
2. Gets rid of all manual work
If you are not able to automate manual work in 2020, you are wasting a lot of time. Time is money and for marketers that are expanding to new channels almost every day for multiple clients, time is invaluable.
Supermetrics has a highly flexible sidebar that can help you get metrics for no matter how many websites you manage. You can get the inside in just a matter of a few seconds as Supermetrics fetches the data automatically.
Not only does it help you save a lot of time, but it also gives better equality for all your presentations. Supermetrics follow the motto of minimal maintenance and maximum observation. They want marketers to use their time in delivering value to the client instead of spending hours preparing a report.
3. Eases PPC reporting
Data reporting and visualisation, especially for PPC campaigns, is becoming increasingly challenging and time-consuming. The reason behind it is not just the increasing number of marketing channels available on the internet, it can also be due to a marketer’s increasing client base.
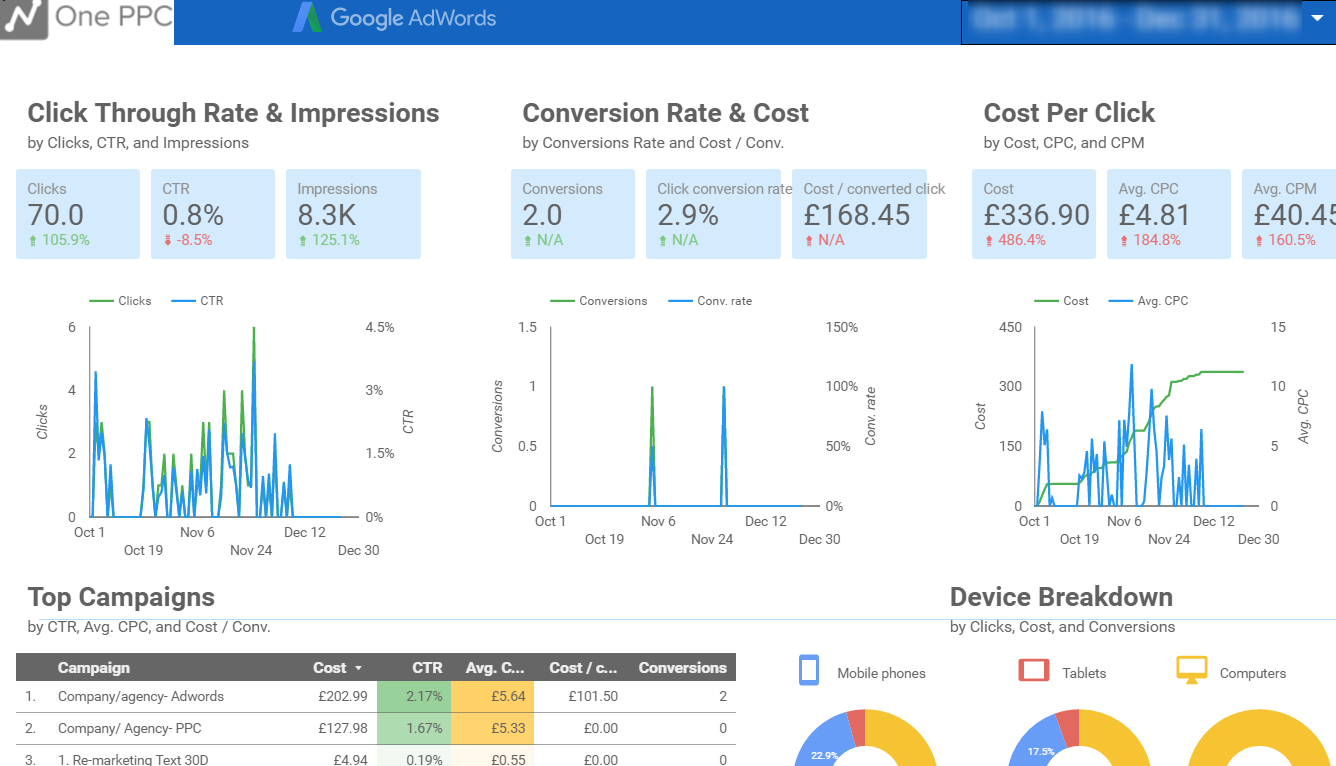
Integrating all the data from multiple channels into a single spreadsheet to compare numbers can leave marketers significantly exhausted. Supermetrics has high quality add on features that can be used on Google Sheets and Google Data Studio to build an Excel report with all the important charts and comparisons.
Not just that, Supermetrics also help you perform channel over channel comparison to figure out the advertising channels you can double down on.
4. Track daily spend efficiently
Paid advertising often requires you to track your campaigns on a daily basis. This is important as you are looking to maximize the ROI of your marketing campaigns.
Supermetrics can help you analyse daily spend without having to go through each campaign separately. Once we have used Supermetrics to collect all the data on a spreadsheet, you can use data validation to go through the ad spend of each client from the drop-down menus.
This not only helps you quickly monitor your client accounts, but it also helps you to gain much more control over the tracking process.
5. Automated performance tracking
One of the most important things that you can do to track performance dips is to set up dashboards and automated alerts. Supermetrics can help you get notified whenever your campaign’s performance steps below the expected level.
This is a great way to eliminate all possible human error and ensure successful monitoring of performance, budgets, and other important metrics related to a particular marketing campaign.
Different Features of Supermetrics
Let’s discuss some of the most important features of Supermetrics.
1. Data Analytics and Visualization
The Google Drive extension of Supermetrics gives You the opportunity to use Google sheets as the reporting format. This can be done from the ‘Add-ons’ menu. The sidebar then allows you to choose the required data sources that you want to analyze. The data sources can be Google Analytics, Facebook Ads, or any other marketing channels you have been using. After choosing the desired channel, you can click on ‘Select Views’ and choose the accounts you want to analyze.
Now that you have chosen the required accounts, you can go on and select the metrics you want to analyze. The moment you to the, Supermetrics will make sure it pulls the required data onto your Google sheet.
Once you have the data you want to analyse, you can choose the reporting or the format you want to visualise your data. It can be done in a tabular form, bar graph, pie chart, line chart, area chart, or any other form you want.
You can add as many metrics and dimensions to your data set and visualise them in the format of your choice. This gives you great control over your reports.
2. Email and Automated Refresh Scheduling
Supermetrics has come a long way when it comes to automation. When Supermetrics was launched, it gained a lot of attention for its ability to refresh data with just one click. However, you had to go to the dashboard to do that.
Today, Supermetrics gives you the future of automated refreshing and emailing. This allows you to keep your data up to date by scheduling daily refreshes. This eliminates the need for opening each file and clicking the refresh button.
Supermetrics also helps you share the results with the help of automated emails. This can be done by setting up triggers in the ‘Schedule refresh and emailing’ option. The option can be accessed under the add on menu.
3. Pre-Designed Templates
If you are new to Supermetrics and are looking to get started quickly, you can go with the variety of pre-designed templates. You can choose them according to your choice of metrics and reporting.
To choose a template, you can go to the drop-down menu and look for the template gallery. Choose from the different templates and then select the account that you want to analyse or display. Click on ‘Insert Template’ and you’re good to go.
4. Manage 10,000 Queries
Supermetrics can help you manage almost 10,000 query executions everyday. If you have subscribed to the Pro version, you will be able to manage 1500 questions each day, with the Super Pro version it allows for 10000 executions! You can search for ‘Manage Queries’ in the Add-ons menu.
If you are looking for an all-around business intelligence software that can be customized to your requirements, you must definitely check out Supermetrics. It can significantly reduce the complexities of different processes related to data analysis and representation. Most importantly, it doesn’t come with a steep learning curve which is great for beginners. We hope this piece of content brought great value to you. If you still have questions, feel free to put them down in the comments section. We would love to hear from you!


